Jump to content
  • WELCOME GUEST

    It looks as if you are viewing PalmTalk as an unregistered Guest.

    Please consider registering so as to take better advantage of our vast knowledge base and friendly community.  By registering you will gain access to many features - among them are our powerful Search feature, the ability to Private Message other Users, and be able to post and/or answer questions from all over the world. It is completely free, no “catches,” and you will have complete control over how you wish to use this site.

    PalmTalk is sponsored by the International Palm Society. - an organization dedicated to learning everything about and enjoying palm trees (and their companion plants) while conserving endangered palm species and habitat worldwide. Please take the time to know us all better and register.
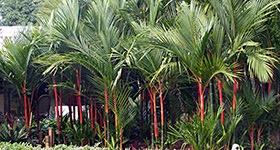
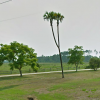
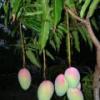
    guest Renda04.jpg

Recommended Posts

Posted
  On 1/20/2016 at 1:13 AM, Bill H2DB said:

Here's the poop on January hereabouts .

Note the info for the 20th , 21st , 22nd and 23rd .      30 years ago...........what an event !


24490663765_65b9b63752_c.jpgDaytona January by Bill H, on Flickr


24464465336_c244ba8dff_c.jpgOrlando January by Bill H, on Flickr

Expand  

That was a bad winter for you guys like '83 was for us here in South Texas.  I am glad those kind of winters are very few and far between.  By the way, your climate there is about spot on to what ours is over here, with an average high/low in Jan. of 67F/47F.

  • 2 weeks later...
Posted

The numbers are in for January, which has proven to be a typical El Nino January for the Orlando area.  Average temperatures have been just a hair below normal, with lows near average and highs a tad below average and above average rainfall (it has been so nice to have such a lush garden with no watering of in-ground stuff the whole month).  The 2016 January averages for Orlando International Airport came in as 68F/50F, with an overall average temperature of 59F.  This is compared to a long term average of 71F/49F.  The lowest official temperature for this month has been 34F at the aforementioned station.  Typically, our lowest temperature in January is around 32F (most winters 30-34F), so in keeping with El Nino norms, the lowest temp was just a bit higher than average, but within the typical range.  Orlando is a USDA zone 10a with outer suburbs and most rural areas nearby being a zone 9b.  Some rural locations well outside of the city, especially to the northwest are actually zone 9a. 

Rainfall for the month at MCO was 5.65" (I know we had significantly more at my location, as 4.5" fell just in the two day rain event a few days ago).  This is close to double the average precipitation for the month of January.  In my immediate area, there have been absolutely no flooding issues and I have not noticed any disease issues whatsoever in my yard that can result from prolonged, wet and cool weather.

If every January could be like this one here, I would be thrilled.  Nice to have a break from 80F+ temperatures.  Let's see how February goes!

Posted
  On 1/31/2016 at 11:48 PM, palmsOrl said:

 Orlando is a USDA zone 10a with outer suburbs and most rural areas nearby being a zone 9b.  

Expand  

I have trouble believing Orlando is really 10a. I compare it to Tampa, which is debatably 9b, and Orlando is further north and away from the water (apart from the lakes) so I don't really see a strong argument for why it should be more than 9b unless the urban heat island is stronger than I'm appreciating. I'm not saying it isn't 10a, I'm just not clear on why it would be. 

Howdy 🤠

Posted
  On 2/1/2016 at 12:08 AM, RedRabbit said:

I have trouble believing Orlando is really 10a. I compare it to Tampa, which is debatably 9b, and Orlando is further north and away from the water (apart from the lakes) so I don't really see a strong argument for why it should be more than 9b unless the urban heat island is stronger than I'm appreciating. I'm not saying it isn't 10a, I'm just not clear on why it would be. 

Expand  

I've had the same amount of confusion. Tampa is a really big city adjacent to a large body of water, and is further south, but there are spots of Orlando that are as warm as anything in Tampa (except maybe Davis island). Leu Gardens is a good place to go to see this first-hand. There are even a few coconuts that survived 2010 in Orlando. 

I'm not sure why this is the case though. I think that Tampa is just unusually cold, because St. Pete and Clearwater seem much warmer, even though they're just on the other side of the bay. 

Keith 

Palmetto, Florida (10a) and Tampa, Florida (9b/10a)

Posted

Good points RedRabbit.  I haven't done the necessary research into Tampa's climate data to say for sure, but I bet Metro Tampa (and certainly many nearby areas) is a solid zone 10a.  Some microclimates in that area, such as Anna Maria Island, are zone 10b, as discussed in previous Palmtalk threads.  Also, I have no doubt that much of the inland Tampa Bay area is zone 9b, with some 9a areas as well.  The climate of the different spots around the Tampa Bay area is so complex and varied, due to the particular geography and numerous other factors affecting the area.

As far as Orlando is concerned, with the past 25 years of data excluded, it was very possibly in the past (without the influence of man) a zone 9b, and perhaps a colder 9b, due to the city's relatively high latitude on the FL Peninsula, as well as its distance from the ocean.  So I suspect if one were to go back to, for example 1950, or 1900 and reliable long term data had been available for a suitable preceding period, a detailed zone map of the Orlando area would have shown a patchwork of 9a and 9b climates, with zone 9b spots being prevalent on the SE sides of larger lakes as well as generally becoming gradually more common with decreasing latitude.  Elevation is also a factor, as Walt has explained on here quite well.

The thing is, man has changed the area with all of the urban/suburban development and many factors related to this development put off heat and/or hold more heat and for longer than the environment did before mankind moved in.  Thus, the Orlando metro area has significantly higher temperatures than the same area did in the past (before human civilization and urbanization) and higher temperatures than comparable surrounding areas, due to this urban heat island effect.  Generally speaking, this disparity is most significant during colder weather and from my current knowledge, exhibits its greatest effect on extreme/record cold low temperatures as well as on average annual temperature minima for locations within the affected area.  This urban heat island effect also tends to be greatest near the city center and the effect is less and less in magnitude as distance from the city increases.  This elevation in temperatures no doubt began to occur and increased gradually in degree over the past 150 or so years, and particularly over the last 50-60 years.  In fact, I feel the effect has only become substantial over roughly the past two to three decades as the city has continued to grow and expand.

So while all the natural factors (and current/recent data from surrounding non-urbanized areas) related to the Orlando area's particular location would suggest it has a USDA zone 9b and even a "cold" 9b climate (and probably was in the past), the Orlando metro area is now a zone 10a, due (I believe) to human activity (not talking climate change here).

As far as the USDA hardiness zone classification system is concerned, average annual minimum temperatures over a certain number of years is what defines a location's particular zone.

Here is a summary of the evidence supporting my assertion that the Orlando metro area is now a USDA zone 10a climate:

- A data chart of annual minimum temperatures at the Orlando Executive Airport for the period of 1949 - 2014, indicate that the average annual low during this period has been 30-31F (see attached chart, thank you Keith Zimmerman for posting this chart in a recent Palmtalk thread).

-In my searches, I had only been able to find reliable temperature data for the Orlando Executive Airport going back to the year 1988.  The average annual low temperature for this station from 1988-2015 is 32.3F.

- For the Orlando International Airport, the average annual minimum temperature from 1953-2015 is 29.6F.

- For the most recent 30-year period (which is the typical time frame used to calculate USDA zones) from 1986-2015, the average annual minimum temperature at the Orlando International Airport is 30.9F.

Data going further back (versus the most recent 30-year period) includes years during which the urban heat island effect was less and less of a factor on annual temperature minima.  Clearly, if you were to consider data from the two official Orlando weather stations from 1949/1953-2015, Orlando would be considered a very low end or marginal 10a climate.  Indeed, 1953-2015 data from the Orlando International Airport alone could be used to classify Orlando as a high end borderline 9b climate (29.6F average annual low). 

Data from the typical, most recent 30-year period at both stations clearly indicates that Orlando is a solid zone 10a climate, "lower end" certainly but not borderline.  The data also strongly hints at the fact that the average annual minimum temperature in Orlando is gradually increasing, in my opinion, due entirely to the urban heat island effect.

Just for the sake of including another piece of data, the Orlando Sanford International Airport's average annual low temperature from the 1986-2015 period is 30.5F.


  • Upvote 1
Posted

I had trouble getting that chart posted.  Here it is.orlando%20executive%20airport%20minimums  

orlando executive airport minimums 1949 - present.png

Posted

The USA zones can be confusing. Like I said in another thread, Cape Coral where I live is zone 10a, but then Orlando is zone 10a. Now I understand the zones go by the average low temps but I think there should be more to it than that. If you drive around Cape Coral and Ft Myers and then go to Orlando you will see a huge difference it the way it looks, meaning the tropical look. I think there should be a different zoning for Florida like California has. There should be a difference of zone 10a in Cape Coral and zone 10a in Orlando which is 160 mile north of here. 

What should be put in consideration is average highs and lows, which are lower in Orlando than in Cape Coral. Also the duration of cold nights are longer in Central Florida. Here in Cape Coral you see coconuts palms everywhere and look great, but you have to really look for them in Orlando. Even in St Pete they are not common.

We can grow a lot more tropicals in Cape Coral then you can in Orlando, but we live in the same zone, that can be confusing to people.


  • Upvote 1

Lived in Cape Coral, Miami, Orlando and St. Petersburg Florida.

Posted (edited)

palmsOrl, thank you for your thorough explanation. I'm really surprised the urban heat island effect is that strong. I would have thought it might make a 1-2 degree difference but not 4-5 which appears to be the case. I'm interested in doing similar research for the Tampa Bay Area, where did you get all the historical temperature data? 

Palmaceae, you make a good point about other important factors USDA omits. If I were to tour Orlando and Ft. Myers I'd swear Ft. Myers is at least 1 zone higher if I didn't know better. 


Edited by RedRabbit

Howdy 🤠

Posted
  On 2/1/2016 at 2:54 AM, RedRabbit said:

palmsOrl, thank you for your thorough explanation. I'm really surprised the urban heat island effect is that strong. I would have thought it might make a 1-2 degree difference but not 4-5 which appears to be the case. I'm interested in doing similar research for the Tampa Bay Area, where did you get all the historical temperature data? 

Palmaceae, you make a good point about other important factors USDA omits. If I were to tour Orlando and Ft. Myers I'd swear Ft. Myers is at least 1 zone higher if I didn't know better. 


Expand  

Exactly, and that is why there is so much confusion, so far this winter here in the Cape we are experiencing zone 11a. While Orlando hit the low part of 10a and parts of that area hit zone 9b.

Lived in Cape Coral, Miami, Orlando and St. Petersburg Florida.

Posted

You are absolutely right, Palmaceae.  It is confusing.  While the number of tropical palms and other zone 10 plants seen in the Orlando area has increased dramatically over the past 25 years, even downtown Orlando has nothing compared to a place like Cape Coral.  Cape Coral's average annual temperatures, average winter lows and highs, and average annual lows as well as all-time record lows are all significantly higher than Orlando's.  In fact, Cape Coral has a tropical savanna climate whereas Orlando has a humid subtropical climate.

I agree that there should be some sort of climate zone classification system that assigns zones based on multiple factors that might give the average gardening enthusiast a better idea of what his/her climate would realistically allow to be planted successfully long term.  The zone assigned to a particular location could include the simple addition of the lowest temperature ever recorded at that location in brackets at the end of the stated zone.  This would allow one to quickly reference one other important variable in deciding what to include in the garden.  For example, this classification could read:

Orlando: "Enhanced USDA Gardening Zone" 10a(18)

Cape Coral: "Enhanced USDA Gardening Zone" 10a(24)

Miami: "Enhanced USDA Gardening Zone" 10b(26)

Key West: "Enhanced USDA Gardening Zone" 11b(41)

Jacksonville: "Enhanced USDA Gardening Zone" 9a(7)

This could be improved upon even further by adding the average annual number of "chill hours", or hours with temperatures at or below 45F.  The system of chill hours typically excludes hours at temperatures below 32F, but for this application I think that they should be included.

So, for Orlando, the zone rating could read (I am guessing on the number of chill hours for Orlando, 230, based on a map):

Orlando: "Enhanced USDA Gardening Zone" 10a(18)230

Miami: "Enhanced USDA Gardening Zone" 10b(26)18

One of the above classification systems would of course be more complicated for the layman to interpret and could cause more, rather than less confusion, unless the format and accompanying explanations/maps are designed clearly and concisely.


  • Upvote 1
Posted
  On 2/1/2016 at 3:33 AM, palmsOrl said:

You are absolutely right, Palmaceae.  It is confusing.  While the number of tropical palms and other zone 10 plants seen in the Orlando area has increased dramatically over the past 25 years, even downtown Orlando has nothing compared to a place like Cape Coral.  Cape Coral's average annual temperatures, average winter lows and highs, and average annual lows as well as all-time record lows are all significantly higher than Orlando's.  In fact, Cape Coral has a tropical savanna climate whereas Orlando has a humid subtropical climate.

I agree that there should be some sort of climate zone classification system that assigns zones based on multiple factors that might give the average gardening enthusiast a better idea of what his/her climate would realistically allow to be planted successfully long term.  The zone assigned to a particular location could include the simple addition of the lowest temperature ever recorded at that location in brackets at the end of the stated zone.  This would allow one to quickly reference one other important variable in deciding what to include in the garden.  For example, this classification could read:

Orlando: "Enhanced USDA Gardening Zone" 10a(18)

Cape Coral: "Enhanced USDA Gardening Zone" 10a(24)

Miami: "Enhanced USDA Gardening Zone" 10b(26)

Key West: "Enhanced USDA Gardening Zone" 11b(41)

Jacksonville: "Enhanced USDA Gardening Zone" 9a(7)

This could be improved upon even further by adding the average annual number of "chill hours", or hours with temperatures at or below 45F.  The system of chill hours typically excludes hours at temperatures below 32F, but for this application I think that they should be included.

So, for Orlando, the zone rating could read (I am guessing on the number of chill hours for Orlando, 230, based on a map):

Orlando: "Enhanced USDA Gardening Zone" 10a(18)230

Miami: "Enhanced USDA Gardening Zone" 10b(26)18

One of the above classification systems would of course be more complicated for the layman to interpret and could cause more, rather than less confusion, unless the format and accompanying explanations/maps are designed clearly and concisely.


Expand  

I think your on to something here....


Posted
  On 2/1/2016 at 3:33 AM, palmsOrl said:

You are absolutely right, Palmaceae.  It is confusing.  While the number of tropical palms and other zone 10 plants seen in the Orlando area has increased dramatically over the past 25 years, even downtown Orlando has nothing compared to a place like Cape Coral.  Cape Coral's average annual temperatures, average winter lows and highs, and average annual lows as well as all-time record lows are all significantly higher than Orlando's.  In fact, Cape Coral has a tropical savanna climate whereas Orlando has a humid subtropical climate.

I agree that there should be some sort of climate zone classification system that assigns zones based on multiple factors that might give the average gardening enthusiast a better idea of what his/her climate would realistically allow to be planted successfully long term.  The zone assigned to a particular location could include the simple addition of the lowest temperature ever recorded at that location in brackets at the end of the stated zone.  This would allow one to quickly reference one other important variable in deciding what to include in the garden.  For example, this classification could read:

Orlando: "Enhanced USDA Gardening Zone" 10a(18)

Cape Coral: "Enhanced USDA Gardening Zone" 10a(24)

Miami: "Enhanced USDA Gardening Zone" 10b(26)

Key West: "Enhanced USDA Gardening Zone" 11b(41)

Jacksonville: "Enhanced USDA Gardening Zone" 9a(7)

This could be improved upon even further by adding the average annual number of "chill hours", or hours with temperatures at or below 45F.  The system of chill hours typically excludes hours at temperatures below 32F, but for this application I think that they should be included.

So, for Orlando, the zone rating could read (I am guessing on the number of chill hours for Orlando, 230, based on a map):

Orlando: "Enhanced USDA Gardening Zone" 10a(18)230

Miami: "Enhanced USDA Gardening Zone" 10b(26)18

One of the above classification systems would of course be more complicated for the layman to interpret and could cause more, rather than less confusion, unless the format and accompanying explanations/maps are designed clearly and concisely.


Expand  

I like your chill hours idea. I also think the standard deviation of annual low temps would be very useful. In Tampa we are fine in any given year, but it is the 2nd st dev of low temps that wipe everything out. I'm pretty strong on Excel, given the right data sets I could probably find some insightful conclusions but I'm not sure where you'd be able to acquire sufficiently detailed historical information.

Howdy 🤠

Posted (edited)

Thank you TexasColdHardyPalms. 

I was just thinking over this subject a bit more and got to thinking that the three types of data included in my second idea above (a set of numbers including average annual minima, extreme lowest temperature on record and chill hours) should give one a pretty good overall idea of what will be suitable for planting in a given location.  This would certainly work for the State of Florida. 

A grower in Jacksonville could decide, "Okay, I'm a zone 9a(7)550 so Sabals are a good choice, maybe a queen palm in a protected area would work as an experiment but I won't expect it to survive the next 7F cold snap, but nix the royal palm I was thinking about, and I'm in zone 9, just like with the older classification system so I can't grow an apple tree, but look, my area averages 550 chill hours per year, so a "low chill" apple variety might grow and actually bear fruit here.

A gardener living in a rural area next to Archbold Biological Station, zone 9a(13)120 may come to the same conclusion as the Jacksonville grower as far as palms, but may learn that 120 chill hours won't cut it for any apple variety, or some of the other temperate trees that may just barely do okay in Jacksonville.

An Orlando 10a(18)230 palm grower can say, "Look, I am in the same zone as Fort Myers like under the old system so royals and foxtails and that gorgeous golden Malaysian dwarf variety coconut should do okay, but this new system makes it clear that the first two won't be around forever and my location has too many chill hours to get that golden Malaysian dwarf coconut I've wanted to try through even one or two winters in a protected spot.  This low chill peach tree will be an interesting addition to the front yard, I see that certainly wouldn't work in Fort Myers".


I agree RedRabbit, gathering adequate historical data for each specific location would be a major challenge (with a lot of "holes" in data), but no doubt those who maintain the USDA maps could access any existent data.  At the very least, collection of this type of data could begin and even a network of weather stations set up where needed so that such an enhanced system could be developed and implemented eventually (30 years from now).  I am sure you are much better than I at statistics, but I really like your idea of including standard deviations in temperature as one of the types of data within the proposed new system.  Do you think that listing the extreme lowest temperature on record for a location tends to correspond reliably with two standard deviations of low temperature from the average annual low?  I am really interested in hearing more about how you think that might be included.

Edited by palmsOrl
add punctuation
Posted

It was a very pleasant January in Houston this year. The average temperature was nearly normal with below average rainfall. Most of the rain fell on a few occasions and that resulted in many sunny and mild days in the 70s, with intermingled cool spells. Many winters in Houston are cool and wet but so far it has been nice, despite the El Nino forecast. The lowest thus far for this season occurred in January with 34F, not bad for Houston.

Ed in Houston


    STATION:   HOUSTON/HOBBY AIRPORT
    MONTH:     JANUARY
    YEAR:      2016
    LATITUDE:   29 38 N
    LONGITUDE:  95 17 W


DY MAX MIN AVG DEP 
================================================================================

 1  51  46  49  -5  
 2  52  46  49  -5  
 3  61  44  53  -1  
 4  62  39  51  -3  
 5  57  39  48  -6  
 6  63  47  55   1  
 7  70  54  62   8   
 8  69  50  60   6   
 9  64  44  54   0  
10  53  39  46  -8  
11  53  36  45  -9  
12  64  38  51  -3  
13  65  39  52  -2  
14  64  49  57   3   
15  74  49  62   8   
16  57  46  52  -2  
17  58  40  49  -5  
18  62  38  50  -4  
19  70  44  57   3  
20  66  50  58   4  
21  74  45  60   6  
22  54  41  48  -6  
23  57  35  46  -8  
24  69  38  54   0  
27  58  44  51  -3  
28  66  34  50  -5  
29  74  41  58   3   
30  76  48  62   7  
31  78  63  71  16  

================================================================================
AV 63.8 44.2                         
                                
================================================================================

[TEMPERATURE DATA]      [PRECIPITATION DATA]       

AVERAGE MONTHLY: 54.0   TOTAL FOR MONTH:   2.51   
DPTR FM NORMAL:  -0.1   DPTR FM NORMAL:   -1.36    
HIGHEST:    78 ON 31    
LOWEST:     34 ON 28                              


Posted

Weather Underground is a fantastic resource for microclimates.  The next cold morning, pull up any of the cities mentioned above and check the reporting stations.  My area of Tampa is consistently 2-3 degrees warmer than the TPA airport and about 1 degree cooler than the Davis Island reporting station.  Similarly, the reporting stations near Leu appear to be the warmest in Orlando and 3-4 degrees warmer than MCO.  I would say both of these microclimates are barely 10a.  For the record, my garden has been below 30F 2 times in 20 years but in the 30-32F range six times. 

No one cares about your current yard temperature 🙃

Posted
  On 2/1/2016 at 5:44 AM, RedRabbit said:

I like your chill hours idea. I also think the standard deviation of annual low temps would be very useful. In Tampa we are fine in any given year, but it is the 2nd st dev of low temps that wipe everything out. I'm pretty strong on Excel, given the right data sets I could probably find some insightful conclusions but I'm not sure where you'd be able to acquire sufficiently detailed historical information.

Expand  

Interesting idea about the standard deviation.

From the data for some of the cities we've been discussing, 

Orlando (from the executive airport) has an average annual minimum of 30.41˚, with a std dev of 4.85˚

Tampa (from the Tampa Intl airport) has an average annual minimum of 30.51˚, with a std dev of 4.68˚

Clearwater (from the Clearwater/St. Pete Intl airport) has an average annual minimum of 34.79˚, with a std dev of 4.20˚

Ft. Myers (from the Ft. Myers intl airport) has an average annual minimum of 34.06˚, with a std dev of 3.65˚

Brownsville (from the Brownsville intl airport) has an average annual minimum of 31.75˚ with a std dev of 4.94˚


Clearwater vs. Ft. Myers is an interesting one, because the average annual minimum is actually higher in Clearwater, but it has a larger standard deviation, so it will be colder in the coldest years. If you look more into the data, Clearwater has an average high of 71.4˚ and an average low of 52.9˚ for the coldest month. Ft. Myers has an average high of 74.7˚ and an average low of 53.7˚.


During this time period (all data since 1949), the coldest temperature recorded in Clearwater was 22˚ on December 13, 1962. The coldest temperature in Ft. Myers was 26˚ on December 13, 1962.

The average annual minimum doesn't tell you the whole story.

  • Upvote 1

Keith 

Palmetto, Florida (10a) and Tampa, Florida (9b/10a)

Posted

Orlando as a whole is a solid 9b. Its just that there are a lot of microclimates in the urban areas that are BORDERLINE 10a. I don't think Orlando is a solid zone 10. Besides the urban heat island thing, there are hundreds of lakes in Orlando and the older parts of Orlando/Winter Park have good older Southern Live Oak and Camphor Tree canopies. Even here at Leu Gardens the temperature on a still cold night can vary 6-9 degrees on our 50 acres. 

I have seen old photos of Orlando, read accounts and have heard from people that were here and there were always lots of near zone 10 microclimates in Orlando. There used to be trunking coconuts, royals, ficus, royal poincianas, etc growing around here and one main street was lined with Adonidia. The freezes of 1957-58 killed or damaged a lot of these plants followed by 1962. Then it was decent again  until 1983 when the first of the 3 '80s freezes hit. Since then I think the metro area has gotten a bit warmer but outside of town in the b'burbs get cold. Areas northwest of town may even be borderline 9a. Just a couple weeksd ago when it was only mid 30s in town some more rural areas NW of Orlando out towards Apopka and Plymouth and even west of Lake Mary were around 26-28F.


In the last big freeze, Christmas 1989, the temperatures were around 19-20F for 2 nights in Orlando. This was the 3rd of the 3 devasting, record freezes in the 1980s. Since then the coldest it has been is 26F in 1996 and 27F in 2003. 2009-10 winter was a totally different winter, one I had never experienced in 35 years of living in FL. The absolute low wasn't bad, juts the duration. The coldest night that winter only got to 29F but that night it stayed below freezing for 12 hours. Also there were 11 other nights where it got between 30-32F. There were also many days the highs were only in the upper 40s/low 50s. It did damage a lot of zone 10 plants and even kill some but others that are more cool tolerant survived with no damage. So that winter only damaged borderline zone plants. Unlike the freezes of the 1980s that wiped out a lot of zone 10 plants but also severely damaged or killed zone 9 plants like citrus, queen palms, pygmy dates, jacaranda, etc.

Eric

Orlando, FL

zone 9b/10a

Posted (edited)

Maybe one of these days I'll finish my Orange county isotherm map and form a calculation of population density and heat island.  I remember coming up with figures before.

Edited by Jimbean
  • Upvote 1

Brevard County, Fl

Posted
  On 2/1/2016 at 3:33 AM, palmsOrl said:

You are absolutely right, Palmaceae.  It is confusing.  While the number of tropical palms and other zone 10 plants seen in the Orlando area has increased dramatically over the past 25 years, even downtown Orlando has nothing compared to a place like Cape Coral.  Cape Coral's average annual temperatures, average winter lows and highs, and average annual lows as well as all-time record lows are all significantly higher than Orlando's.  In fact, Cape Coral has a tropical savanna climate whereas Orlando has a humid subtropical climate.

I agree that there should be some sort of climate zone classification system that assigns zones based on multiple factors that might give the average gardening enthusiast a better idea of what his/her climate would realistically allow to be planted successfully long term.  The zone assigned to a particular location could include the simple addition of the lowest temperature ever recorded at that location in brackets at the end of the stated zone.  This would allow one to quickly reference one other important variable in deciding what to include in the garden.  For example, this classification could read:

Orlando: "Enhanced USDA Gardening Zone" 10a(18)

Cape Coral: "Enhanced USDA Gardening Zone" 10a(24)

Miami: "Enhanced USDA Gardening Zone" 10b(26)

Key West: "Enhanced USDA Gardening Zone" 11b(41)

Jacksonville: "Enhanced USDA Gardening Zone" 9a(7)

This could be improved upon even further by adding the average annual number of "chill hours", or hours with temperatures at or below 45F.  The system of chill hours typically excludes hours at temperatures below 32F, but for this application I think that they should be included.

So, for Orlando, the zone rating could read (I am guessing on the number of chill hours for Orlando, 230, based on a map):

Orlando: "Enhanced USDA Gardening Zone" 10a(18)230

Miami: "Enhanced USDA Gardening Zone" 10b(26)18

One of the above classification systems would of course be more complicated for the layman to interpret and could cause more, rather than less confusion, unless the format and accompanying explanations/maps are designed clearly and concisely.


Expand  

Thanks PalmsOrl, that makes sense to me. That is what I was I was getting at.  As you said that would make much more sense to people who just moved to Orlando and thinking since they were in zone 10A they would think I can grow coconuts and royals just like Cape Coral/Ft Myers can!

Lived in Cape Coral, Miami, Orlando and St. Petersburg Florida.

Posted

That defeats the current system of classification.

Brevard County, Fl

Posted
  On 2/1/2016 at 6:39 PM, Jimbean said:

That defeats the current system of classification.

Expand  

True but it is flawed in my opinion. I understand the zones and how they work but Florida I believe is a special case.

Lived in Cape Coral, Miami, Orlando and St. Petersburg Florida.

Posted
  On 2/1/2016 at 6:40 PM, Palmaceae said:

True but it is flawed in my opinion. I understand the zones and how they work but Florida I believe is a special case.

Expand  

I agree!  That is why I created my own modified version, where for example I classify zone 10A as 33F to 38F.

Brevard County, Fl

Posted
  On 2/1/2016 at 6:42 PM, Jimbean said:

I agree!  That is why I created my own modified version, where for example I classify zone 10A as 33F to 38F.

Expand  

Sounds good!  The only thing I see with just the low temps being assigned to a zone is that it still does not show the climate differences between say Orlando and Cape Coral.   

Lived in Cape Coral, Miami, Orlando and St. Petersburg Florida.

Posted (edited)

It can certainly be said that a zoning system which incorporates average annual minima, all time extreme low, and chill hours is still flawed and would do even better with additional information (standard deviations, etc.).  The data used for it would be official data, so I would not say it is inaccurate or flawed in that way.  Also, in Florida's case, I feel these three pieces of data together actually give an excellent idea of what will likely do well in a given spot long term, though a thorough understanding of what each component actually means is necessary for each to be helpful.

Assuming one does understand how to interpret each piece of data, it does by itself reveal the difference between Clearwater and Fort Myers/Cape Coral:

Clearwater - 10a(22)210     Fort Myers - 10a(26)120     Orlando - 10a(18)230

I think, in fact, that it also gives an idea of the concept of standard deviation.  Fort Myers is 10a, but the all-time low since 1962 is only 26F, whereas Orlando, also 10a (by definition, at least going by the historical data available from the two official reporting stations) has been down to 18F, and Clearwater 10a has been to 22F.  Though each a 10a, the extreme all time low temperature makes the difference between the three locations pretty clear and the inclusion of chill hours further highlights the differences.

Taking it just one step further, if you were to add the average high and low to the zone rating, I feel that one would have a complete picture of gardening in a particular location, at least in FL. 

Orlando - Enhanced USDA Gardening Zone 10a(71/49 18)230

This is quite complex but should have all the data to paint a complete picture of what will grow in any particular Florida location.  Averages in the coldest month, coldest for the year, coldest ever and generally how much cold an area gets and length of winter.

The reason that a system like the one used for California might not work is that unlike California, the entire state of FL is hot and humid in the summer and has plenty of warmth (though there are still significant variations in especially the length of hot and humid conditions).  For example, any plant that is sensitive enough to require the high amount of heat (as hours 86F+) found in South FL (meaning it wouldn't do well in Central or North FL) could likely be ruled out by instead analyzing how intolerant of cold it is, and the "Enhanced Zoning System" could be used for this.  Also, rainfall within FL varies from around 40" per year in the lower Keys to as high as 68" in parts of the Western FL Panhandle.  But this whole range falls within the same general "in the middle" category versus California which has anywhere from desert to temperate rainforest. The "Sunset Zones" in California deals with variables that are far more wide ranging than what occur in FL.

I believe (but at this point cannot prove) that the 2010 cold events would have been just as severe as those in the 1980s and before in terms of extreme lows if Orlando had the urban heat island effect not been such a strong influence in the immediate area.  The urban heat island was certainly present to an extent during the freezes of the 1980s, but I would argue that at some point in the past 10-25 years, it has reached a threshold of some sort after which its impact has been substantial.  Not that the change and threshold was reached all at one time, but that the change has been gradually increasing.  I plan to look at weather stations (particularly in rural areas to the south and east of Orlando) to see if I can find evidence that Orlando stayed warmer than surrounding areas (which also have many lakes) during the 2010 cold events.

Lastly, as JimBeam said, maybe it would be better to change the ranges for the current USDA zoning system.  I agree that a Zone 10 being defined as average annual lows of 33-38F would give a better idea of where zone 10 plants can be grown successfully long term than how the current system defines it.

Edited by palmsOrl
punctuation
Posted

Very well said PalmsOrl.

Lived in Cape Coral, Miami, Orlando and St. Petersburg Florida.

Posted

 Here is a classic winter pattern .

Current Temps :  Orlando Executive and Int'l ( both ) at  81

                                                             Daytona Int'l        73        

                              My yard ( near the Halifax River )       70.1          


24666490261_0f88b24a86_c.jpgFeb 1 2016 by Bill H, on Flickr

Posted
  On 2/1/2016 at 1:56 AM, Palmaceae said:

The USA zones can be confusing. Like I said in another thread, Cape Coral where I live is zone 10a, but then Orlando is zone 10a. Now I understand the zones go by the average low temps but I think there should be more to it than that. If you drive around Cape Coral and Ft Myers and then go to Orlando you will see a huge difference it the way it looks, meaning the tropical look. I think there should be a different zoning for Florida like California has. There should be a difference of zone 10a in Cape Coral and zone 10a in Orlando which is 160 mile north of here. 

What should be put in consideration is average highs and lows, which are lower in Orlando than in Cape Coral. Also the duration of cold nights are longer in Central Florida. Here in Cape Coral you see coconuts palms everywhere and look great, but you have to really look for them in Orlando. Even in St Pete they are not common.

We can grow a lot more tropicals in Cape Coral then you can in Orlando, but we live in the same zone, that can be confusing to people.


Expand  

Randy,

I know you are talking about South and Central Florida, but I think your idea would be great for the overall USDA Map.  The same situation exists here in South Texas.  On the east side of Corpus Christi near the water, we are barely Zone 10A, and a cool to mild Zone 10A at that, and we are at the absolute northernmost limit where Coconut Palms can be tried in South Texas, but Brownsville, on the other hand is a mild high end 10A and borderline 10B many winters.  Our chilliest normal high/low here in Jan. is 66F/47F, but in Brownsville, it is 70F/51F, which means a world of difference in what you can grow and can't grow, and the Brownsville Coconut Palms look great compared to the Corpus Christi ones.  Granted, the official part of Corpus (the airport is low end 9B), and the only part of Corpus that is actually 10A is a thin line along the east side of town near the water and on the island (solidly 10A), so a more accurate comparison for instance would be my 10A climate (high 65F, low 50F in Jan.) to Brownsville's 10A climate.

John

Posted

I bet the "Enhanced USDA Gardening Zones" system could also work well for Texas (and the remainder of the Deep South states):

Brownsville, TX - 10a(70/5112)120

Corpus Christi, TX - 10a(66/4711)220

Galveston, TX - 10a(62/508)300


Posted
  On 2/2/2016 at 12:42 AM, palmsOrl said:

I bet the "Enhanced USDA Gardening Zones" system could also work well for Texas (and the remainder of the Deep South states):

Brownsville, TX - 10a(70/5112)120

Corpus Christi, TX - 10a(66/4711)220

Galveston, TX - 10a(62/508)300


Expand  

Excellent, William.  I love it, and think we could all brainstorm a new Climate Rating System for all tropical landscapers/gardeners/wholesale growers along the entire Gulf Coast from Brownsville/South Padre to Key West!

John

Posted
  On 2/2/2016 at 1:52 AM, Mr. Coconut Palm said:

Excellent, William.  I love it, and think we could all brainstorm a new Climate Rating System for all tropical landscapers/gardeners/wholesale growers along the entire Gulf Coast from Brownsville/South Padre to Key West!

John

Expand  

Maybe we could come up with a system so good and accurate, that the USDA would jump on the bandwagon in the near future and make it part of their official Climate Zone classification system.

Posted
  On 2/1/2016 at 6:45 AM, palmsOrl said:

Do you think that listing the extreme lowest temperature on record for a location tends to correspond reliably with two standard deviations of low temperature from the average annual low? 

Expand  

Nope, 2 standard deviations would account for about 97.5% of all low temperatures. In other words, once every 40 years you could expect a year colder than 2 stdevs. 3 stdevs would be something like 650 years and going back that far is just pointless... One big advantage of dealing with standard deviations would be you can define what the "long-term" really is and have some idea of what to expect. If that means 30 years to you, you'd be around 1.1 stdevs and you'd know once every 30yrs you can expect a winter with a low temp colder than XX°F. 


  On 2/1/2016 at 1:23 PM, Zeeth said:

Interesting idea about the standard deviation.

From the data for some of the cities we've been discussing, 

Orlando (from the executive airport) has an average annual minimum of 30.41˚, with a std dev of 4.85˚

Tampa (from the Tampa Intl airport) has an average annual minimum of 30.51˚, with a std dev of 4.68˚

Clearwater (from the Clearwater/St. Pete Intl airport) has an average annual minimum of 34.79˚, with a std dev of 4.20˚

Ft. Myers (from the Ft. Myers intl airport) has an average annual minimum of 34.06˚, with a std dev of 3.65˚

Brownsville (from the Brownsville intl airport) has an average annual minimum of 31.75˚ with a std dev of 4.94˚


Clearwater vs. Ft. Myers is an interesting one, because the average annual minimum is actually higher in Clearwater, but it has a larger standard deviation, so it will be colder in the coldest years. If you look more into the data, Clearwater has an average high of 71.4˚ and an average low of 52.9˚ for the coldest month. Ft. Myers has an average high of 74.7˚ and an average low of 53.7˚.


During this time period (all data since 1949), the coldest temperature recorded in Clearwater was 22˚ on December 13, 1962. The coldest temperature in Ft. Myers was 26˚ on December 13, 1962.

The average annual minimum doesn't tell you the whole story.

Expand  

Thanks Zeeth, those results look like this method might have some merit. Combining the chill hours idea with stdevs would likely give us the best idea what can really grow where, practically speaking though I'm not sure the data is out there. 

  • Upvote 1

Howdy 🤠

Create an account or sign in to comment

You need to be a member in order to leave a comment

Create an account

Sign up for a new account in our community. It's easy!

Register a new account

Sign in

Already have an account? Sign in here.

Sign In Now


  • Recently Browsing

    • No registered users viewing this page.
×
×
  • Create New...