
-
WELCOME GUEST
It looks as if you are viewing PalmTalk as an unregistered Guest.
Please consider registering so as to take better advantage of our vast knowledge base and friendly community. By registering you will gain access to many features - among them are our powerful Search feature, the ability to Private Message other Users, and be able to post and/or answer questions from all over the world. It is completely free, no “catches,” and you will have complete control over how you wish to use this site.
PalmTalk is sponsored by the International Palm Society. - an organization dedicated to learning everything about and enjoying palm trees (and their companion plants) while conserving endangered palm species and habitat worldwide. Please take the time to know us all better and register.

-
Similar Content
-
- 5 replies
- 181 views
-
- 19 replies
- 422 views
-
- 228 replies
- 17,571 views
-
data North America Winter 2023-2024 Temperature Screenshots and Data
By kinzyjr,
- wunderground
- wundermap
- (and 2 more)
- 24 replies
- 1,038 views
-
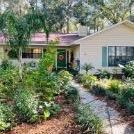
Never look back! (Palms planted in former houses)
By Yunder Wækraus,
- florida
- royal palm
- (and 1 more)
- 5 replies
- 562 views
-


Recommended Posts
Create an account or sign in to comment
You need to be a member in order to leave a comment
Create an account
Sign up for a new account in our community. It's easy!
Register a new accountSign in
Already have an account? Sign in here.
Sign In Now